This is the architecture playbook for scaling a Kubernetes platform beyond 20,000 concurrent users . Not theory. Not vendor slides. These are the patterns, trade-offs, and hard lessons from running production platforms where downtime means revenue loss.
Scaling Kubernetes to handle hundreds of pods is straightforward. Scaling a platform — where 20,000+ users hit your APIs, dozens of teams deploy independently across namespaces, and everyone expects sub-second response times — is an entirely different beast.
Here's what most guides won't tell you: the bottleneck is almost never Kubernetes itself. It's the decisions you make around control plane sizing, tenant isolation, autoscaling behavior, and observability depth. Get these wrong and no amount of compute will save you.
This post breaks down the six pillars that separate a hobby cluster from a production platform serving 20,000+ users. We'll cover the architecture decisions that matter, the trade-offs you'll face at every layer, and the mistakes that take platforms down at scale.
1. Architecture Overview
Before diving into individual components, let's establish what a production platform at this scale actually looks like. This isn't a single application with a load balancer — it's a multi-team ecosystem where infrastructure decisions compound.
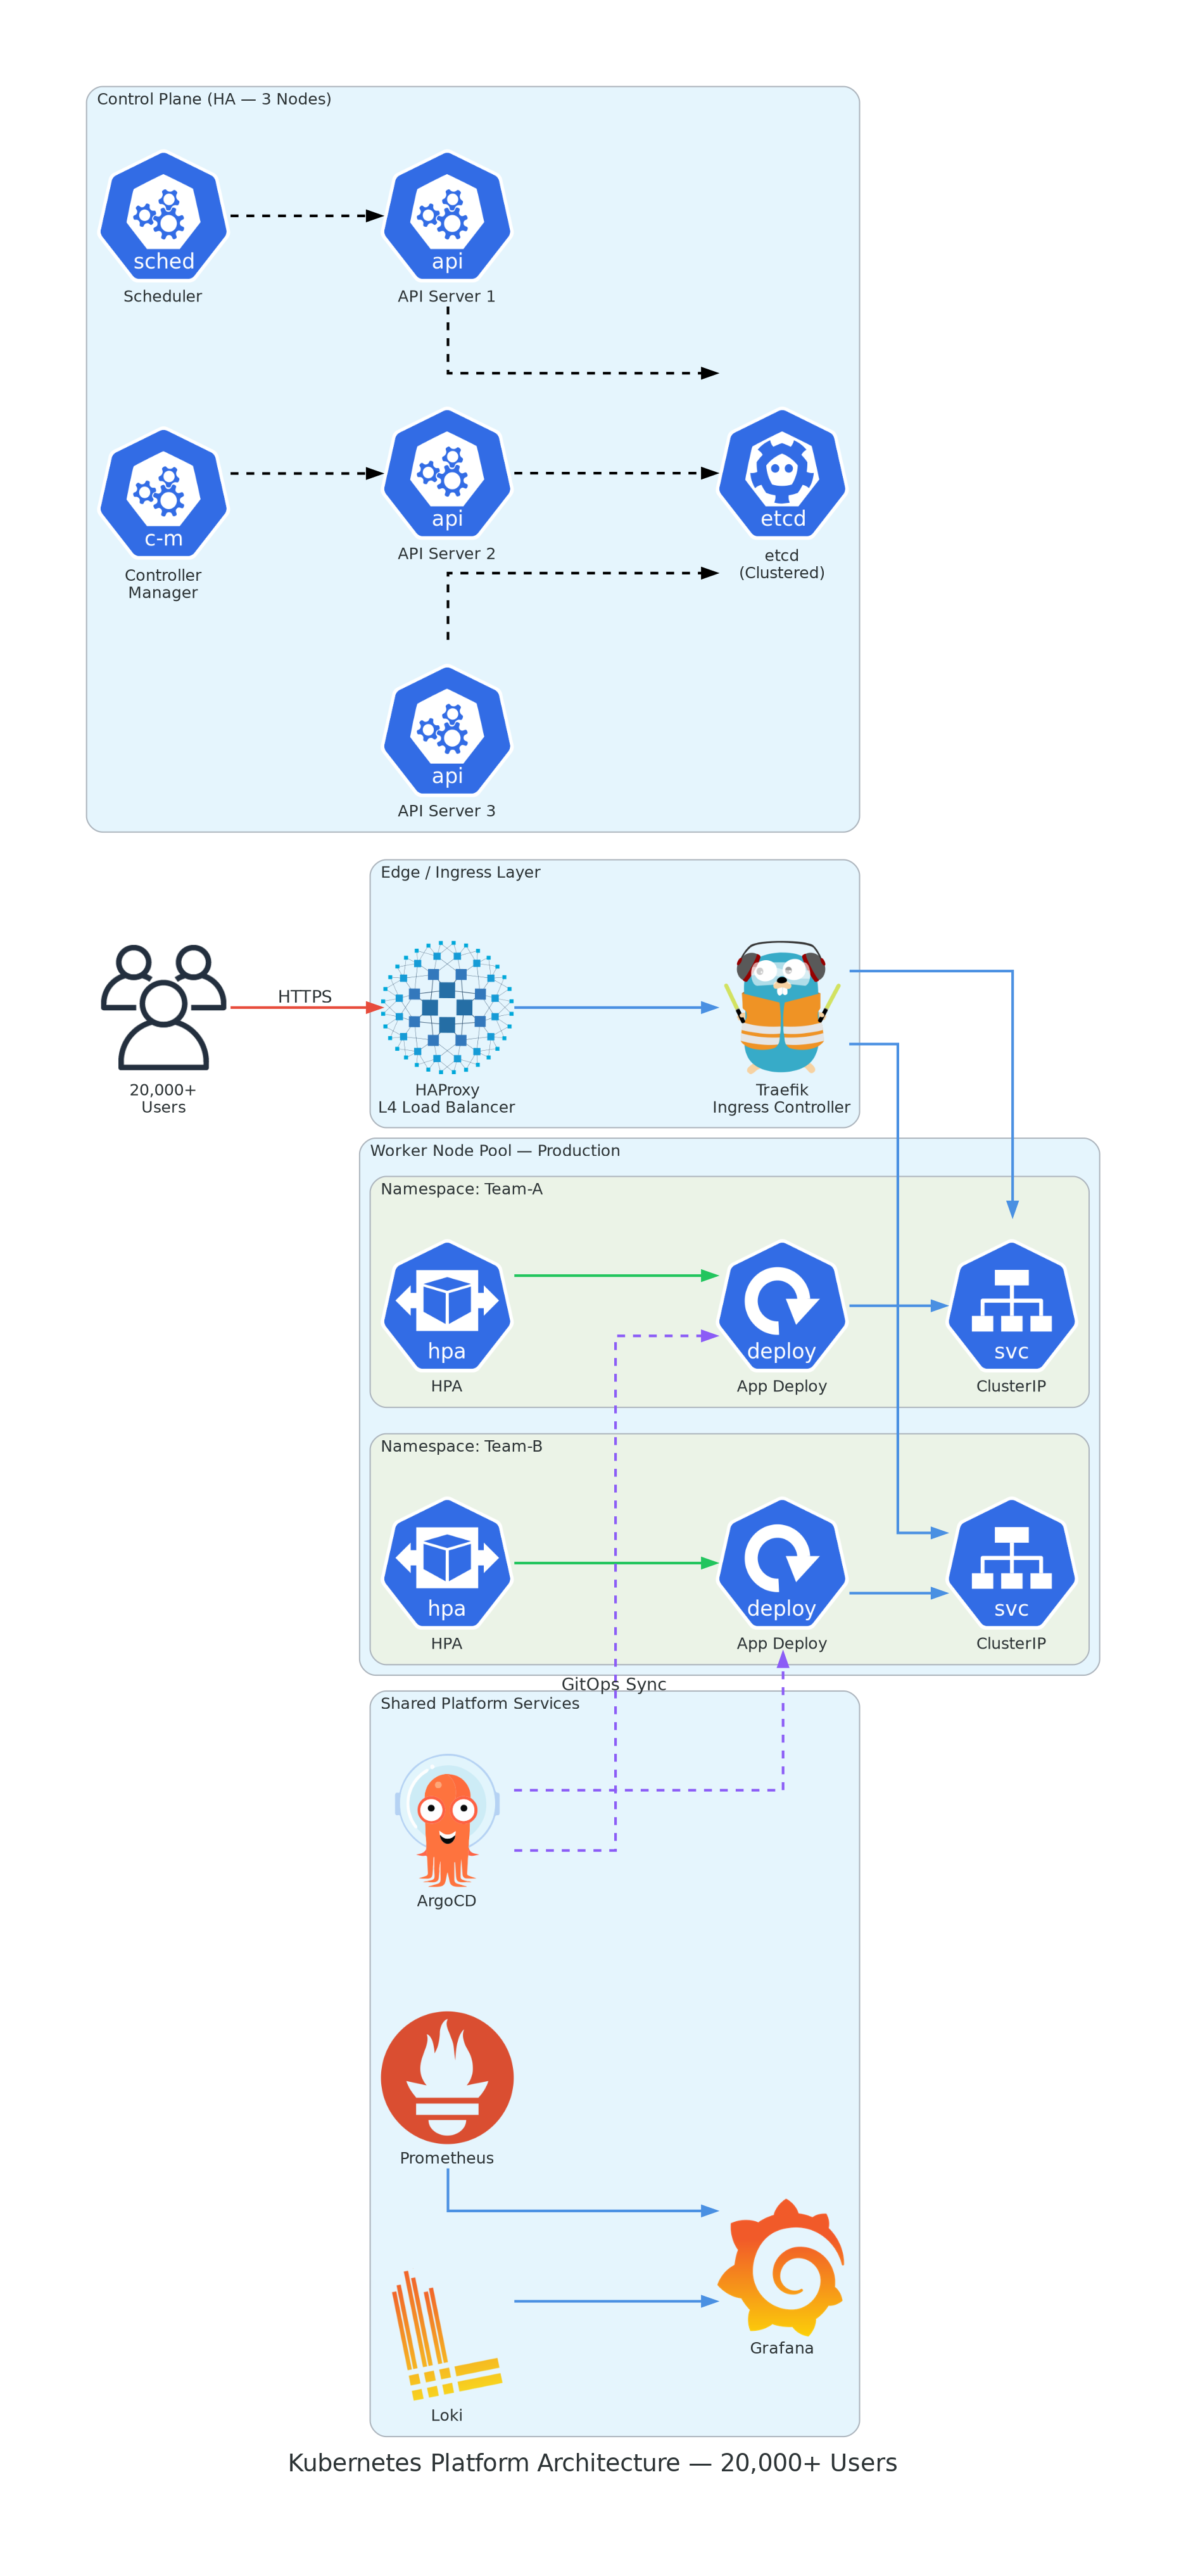
At this scale, five components become non-negotiable: a highly available control plane with a minimum of three nodes and clustered etcd, a dedicated ingress layer with L4 load balancing sitting in front of your cluster, namespace-per-team isolation with hard-enforced quotas, a shared platform services layer running your observability and GitOps tooling, and multi-layer autoscaling that coordinates from pod level up through node provisioning.
The architecture above isn't aspirational — it's the minimum viable platform for 20K+ users. Skip any layer and you'll hit a ceiling that no amount of horizontal scaling can fix.
Key Insight
At 20,000+ users, the first thing that breaks is almost never the application — it's the control plane. An under-resourced API server combined with aggressive HPA polling intervals will throttle every deployment in the cluster. Size your control plane first, then worry about application scaling.
| Component | Small (<1K Users) | Medium (1K–10K) | Large (20K+) |
|---|---|---|---|
| Control Plane Nodes | 1 (non-HA) | 3 (HA) | 3–5 (HA + dedicated etcd) |
| API Server Resources | 2 CPU / 4Gi | 4 CPU / 8Gi | 8 CPU / 16Gi |
| etcd Storage | 50Gi SSD | 100Gi NVMe | 200Gi+ NVMe (dedicated disk) |
| Worker Nodes | 3–5 | 10–30 | 50–200+ |
| Ingress Replicas | 2 | 3–5 | 5–10 (dedicated node pool) |
| Max Pods per Node | 110 (default) | 110 | 64–110 (tune per workload) |
2. Control Plane Hardening
Every request from every user eventually flows through the Kubernetes API server. At 20,000+ users with continuous deployments, the API server handles thousands of requests per second — kubectl commands, HPA controller polls, ArgoCD syncs, Prometheus scrapes, admission webhooks. All of it funnels through the same endpoint.
If the control plane can't keep up, nothing else matters. Your pods won't schedule, your autoscalers won't fire, and your deployments will queue indefinitely.
etcd Performance Is Your Real Ceiling
etcd stores every piece of cluster state — every pod, service, configmap, and secret. At scale, etcd write latency directly correlates with API server response times. The hard target is keeping 99th percentile fsync latency under 10ms. Go above that and you'll see cascading timeouts across the entire cluster.
The three tuning areas that matter most at this scale: heartbeat and election timeouts need to be increased for cross-availability-zone deployments — the defaults assume sub-millisecond network latency that doesn't exist in production. Backend quota needs to be raised from the 2Gi default to at least 8Gi — large clusters with many CRDs and secrets will hit the ceiling faster than you expect. And compaction must run aggressively, ideally every hour, to prevent the database from bloating under continuous write pressure.
The #1 Control Plane Killer
Running etcd on the same disk as the OS or kubelet logs. At 20K+ users, etcd write latency spikes during log rotation and kills API server responsiveness. Always use a dedicated NVMe disk for etcd data. This single change prevents roughly 80% of the control plane stability issues I see in production environments.
API Priority and Fairness — Protecting the API Server from Your Own Users
Kubernetes 1.29+ introduced API Priority and Fairness (APF) as the replacement for the blunt
max-requests-inflight flag. At scale, APF is mandatory — not optional. Without it, a single team
running a misconfigured controller that hammers the API server with list requests can starve the scheduler, the
HPA controller, and every other critical system component.
The principle is straightforward: reserve a guaranteed share of API server capacity for system-critical traffic — leader election, node heartbeats, and controller operations. Everything else competes for the remaining capacity with fair queuing. The teams that need the most API access get it, but never at the expense of cluster stability.
Getting this right requires understanding your traffic patterns. Which service accounts generate the most API calls? Which controllers are the chattiest? Without APF, you're running a 20,000-user platform on hope.
Pro Tip: Audit Before You Configure
Before setting APF policies, enable audit logging on the API server for 48 hours and analyze which subjects generate the most requests. I've seen cases where a single monitoring operator accounted for 40% of all API traffic. You can't protect what you haven't measured.
3. Multi-Tenancy
This is the biggest architecture decision you'll make at this scale. Running a dedicated cluster per team sounds clean on a whiteboard, but in practice you'd drown in control plane costs, operational overhead, and configuration drift across dozens of clusters.
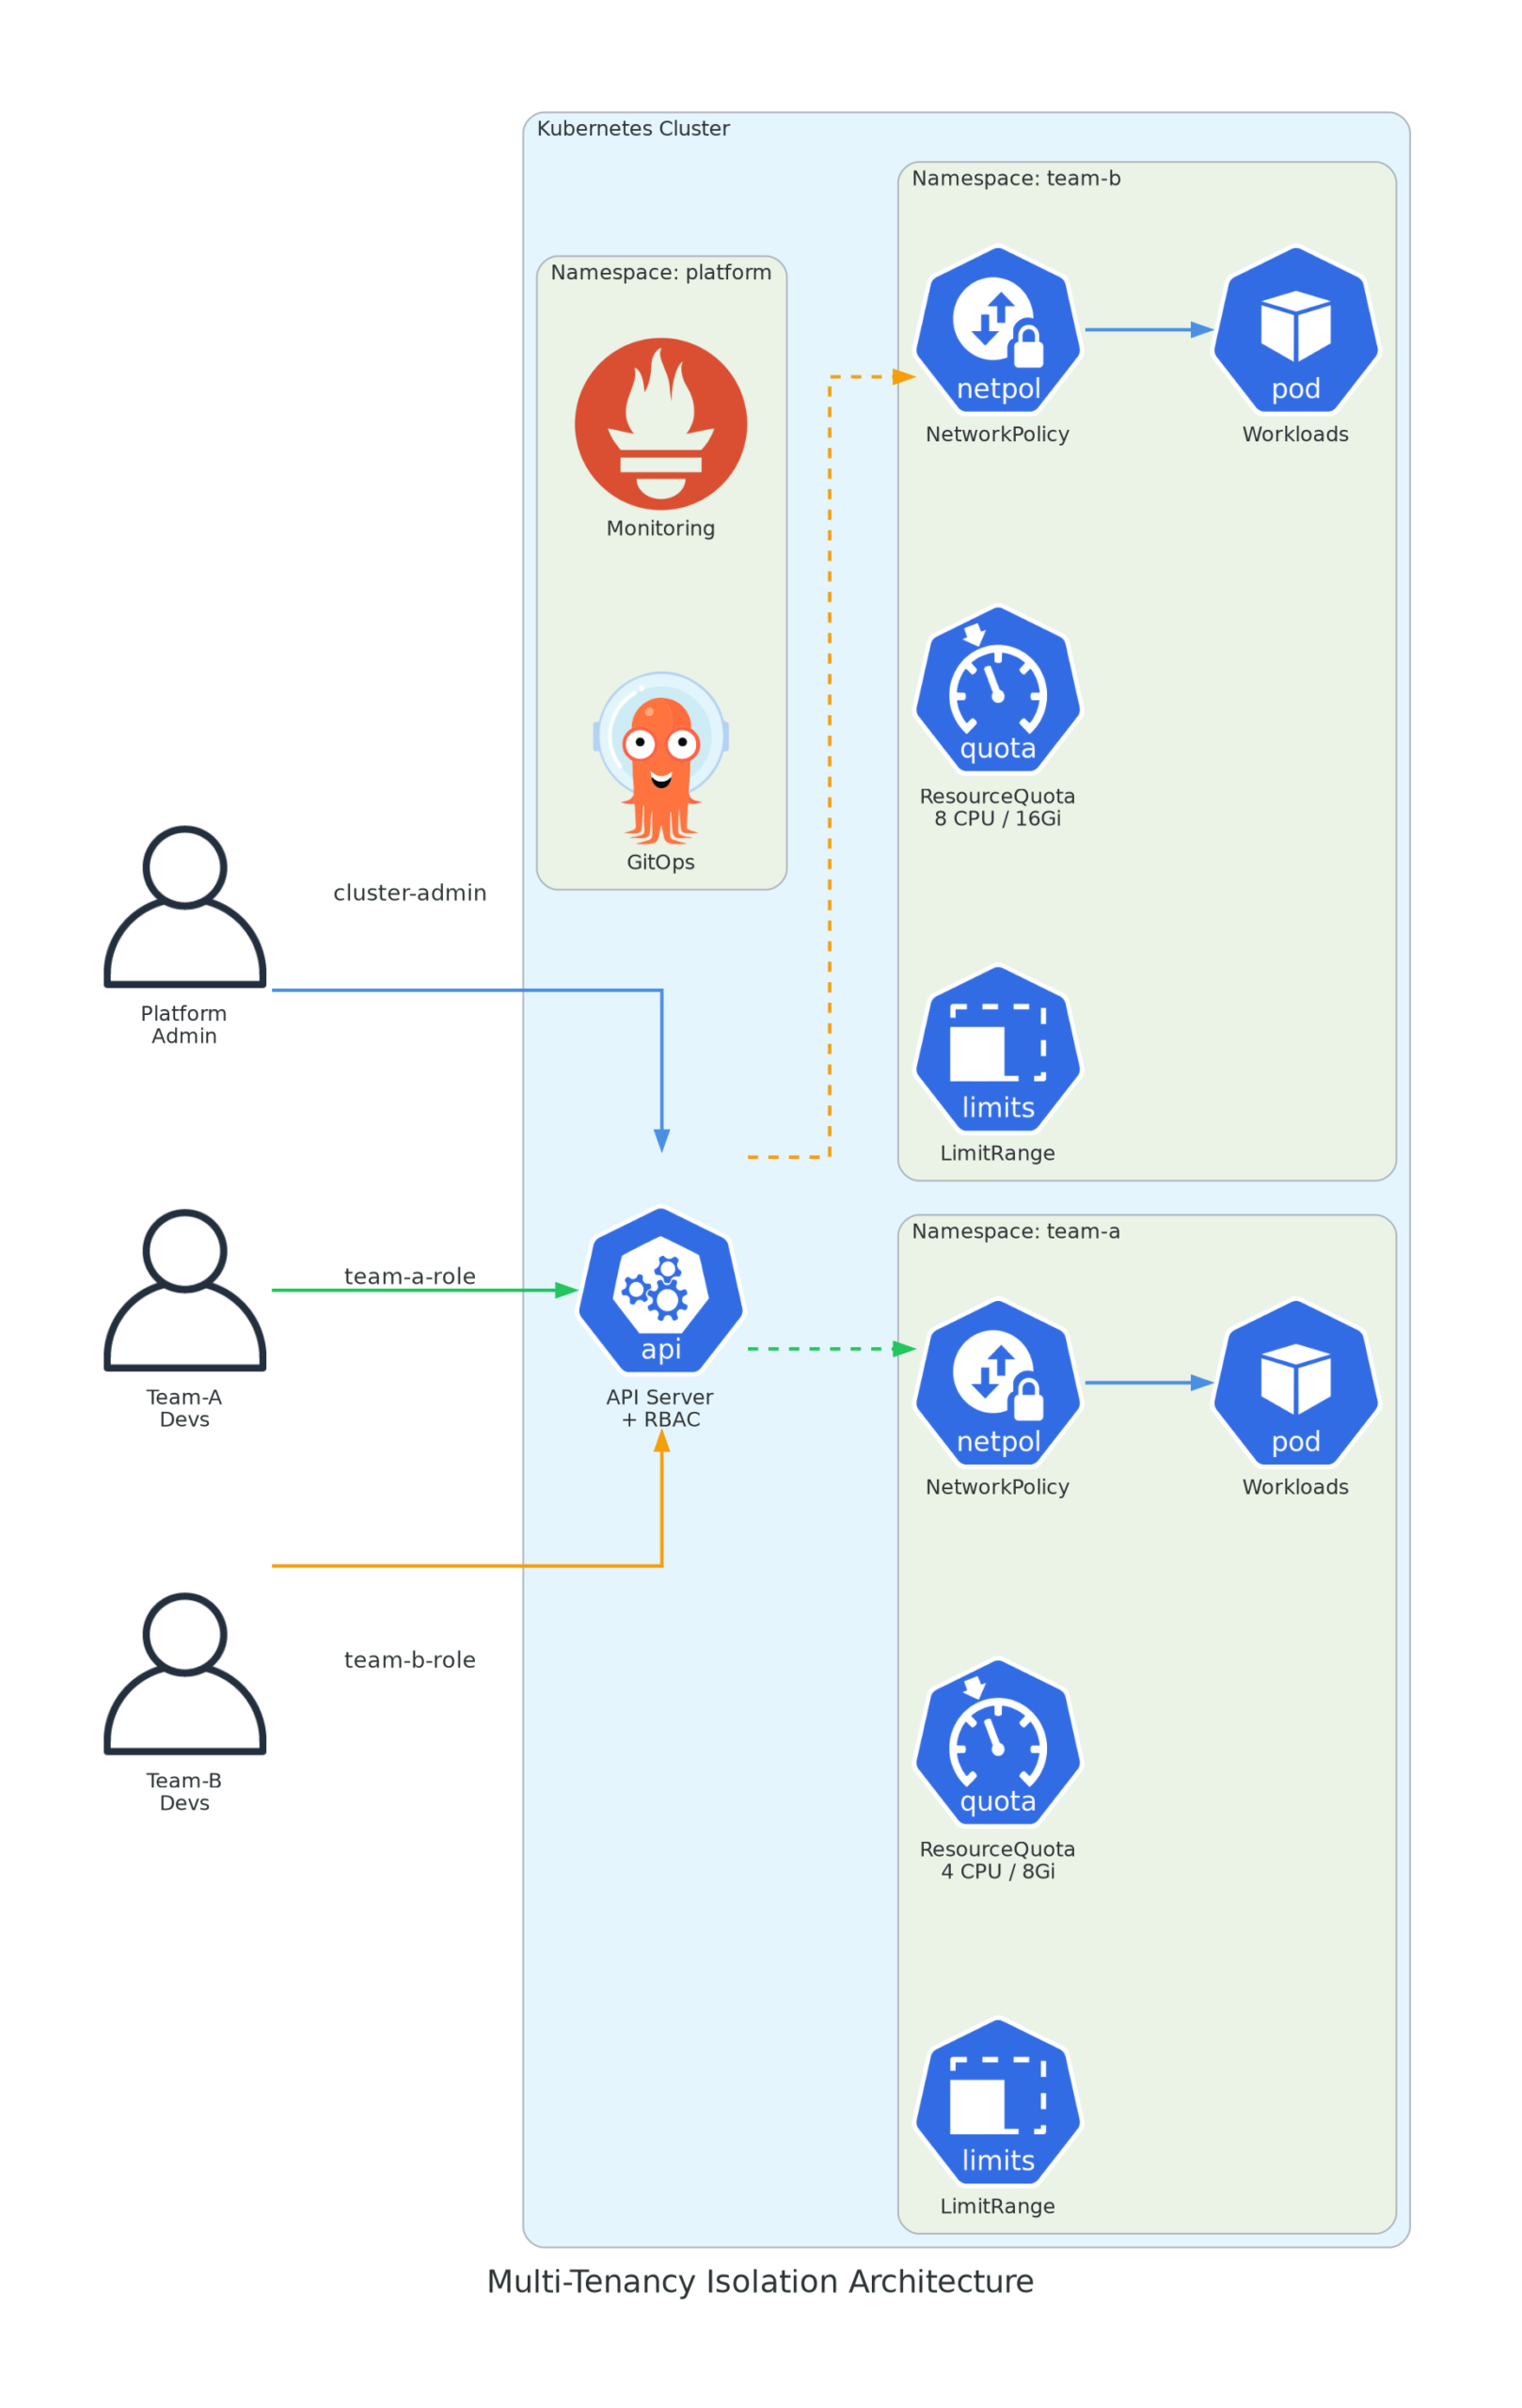
The practical approach for 20,000+ users is soft multi-tenancy with hard enforcement — shared clusters with strong namespace isolation backed by four pillars: NetworkPolicies, RBAC, ResourceQuotas, and LimitRanges. Miss any one of these and your isolation model has a gap that will be exploited — either by accident or by intent.
The Four Pillars of Namespace Isolation
Every tenant namespace must have four resources configured from the moment it's created — no exceptions, no "we'll add it later":
ResourceQuota sets hard caps on what a namespace can consume: total CPU and memory requests/limits, maximum pod count, number of services and PVCs, and total storage. Without this, a single team can allocate the entire cluster's resources and starve everyone else.
LimitRange sets per-container defaults and maximums. This catches the developer who deploys a pod without resource requests — instead of getting unlimited resources, they get sane defaults. It also prevents any single pod from requesting an absurd amount of CPU or memory, even within the quota.
NetworkPolicy with default-deny is where most teams fail. Without an explicit deny-all policy, every pod in every namespace can reach every other pod. At 20,000 users, this means a compromised pod in a dev namespace has a direct network path to your production database. Start with deny-all on both ingress and egress, then explicitly allow only the traffic paths that are required — DNS resolution, API server access, and specific inter-service communication.
RBAC scoped to the namespace controls what each team can actually do. Developers get read/write on their own deployments, pods, and services. Secrets are read-only — the platform team manages secret creation. NetworkPolicies are read-only — no tenant should modify their own isolation boundaries. This isn't about distrust — it's about preventing accidental misconfigurations that cascade across the platform.
The Onboarding Test
Here's how I validate a multi-tenancy setup: create a new namespace, deploy a pod, and try to
curl a service in another team's namespace. If it works, your isolation is broken. Then try
deploying a pod with 64 CPU cores requested. If it schedules, your quotas aren't enforced. These two tests
catch 90% of misconfigured platforms.
Why Default-Deny Is Non-Negotiable
I need to emphasize this because it's the single most common gap I encounter: Kubernetes allows all pod-to-pod traffic by default. There is no built-in network isolation. If you haven't explicitly deployed a deny-all NetworkPolicy in every namespace, every pod on your cluster can talk to every other pod. At 20K users across multiple teams, this is an unacceptable security posture.
The deny-all policy should be part of your namespace provisioning template — applied automatically via GitOps whenever a new team is onboarded. Explicit allow rules are then layered on top for DNS resolution (UDP/TCP 53), API server access, and approved inter-namespace traffic paths. Everything else is dropped.
4. Autoscaling — Three Layers, One Coordinated Strategy
Single-layer autoscaling breaks at 20K scale. It doesn't matter how well-tuned your HPA is — if there's no node capacity to schedule the new pods, they sit in Pending state while your users see timeouts. You need three coordinated layers, each handling a different time horizon.
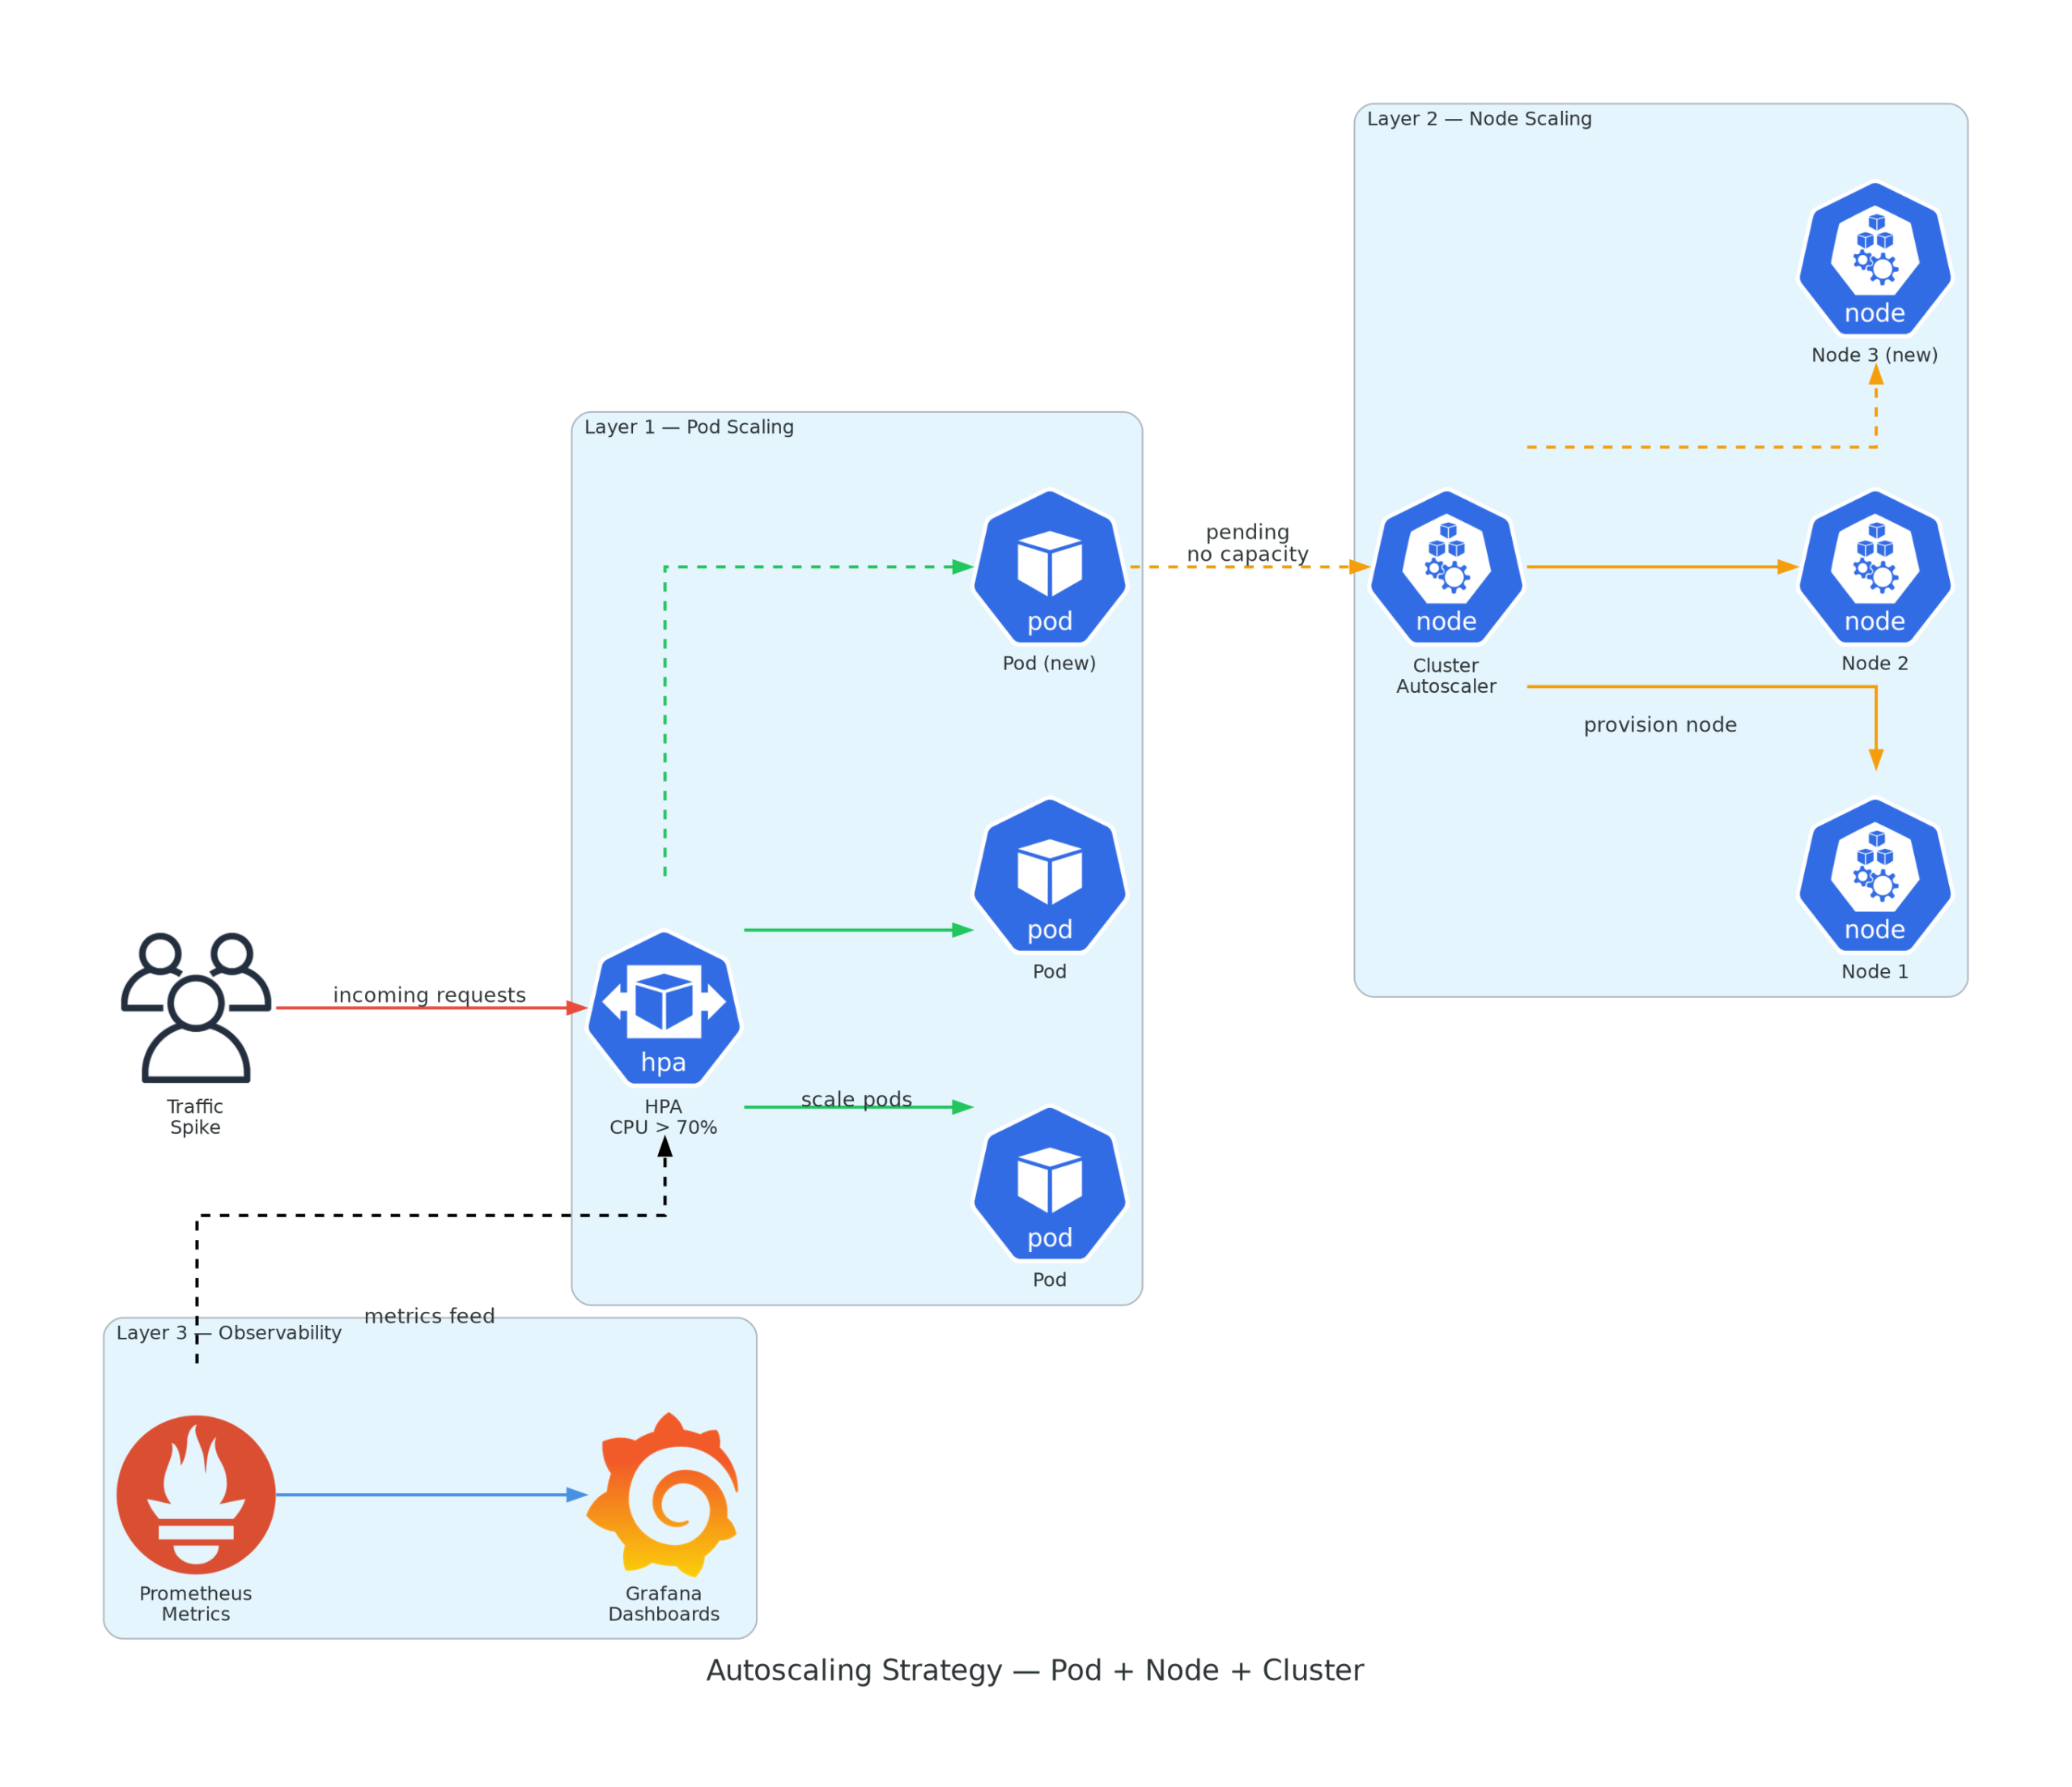
Layer 1: Pod Scaling (HPA) — The First Responder
HPA reacts in 15–30 seconds — it's your first line of defense against traffic spikes. But the defaults will hurt you at scale. Two decisions separate a working HPA from one that causes more problems than it solves:
Target utilization should be 60–70%, not 80%. The default 80% target means you're already running hot before the autoscaler fires. At 20K users, traffic can spike 3x in under a minute. A 65% CPU target gives you headroom to absorb the initial burst while new pods come online. Running at 80% means every spike causes latency before the scale-up takes effect.
Custom metrics matter more than CPU. CPU-based scaling is a lagging indicator — by the time CPU spikes, your users are already experiencing degradation. Use application-level metrics instead: requests per second, queue depth, or p95 latency via Prometheus adapter. These fire earlier and scale more precisely.
The Scale-Down Trap
Aggressive scale-down policies are the #1 cause of user-facing latency spikes in scaled platforms. I've seen teams set 60-second scale-down windows and wonder why their API latency oscillates every few minutes. Use a 5-minute stabilization window with a maximum 20% step-down per cycle. This prevents the "scale-down-then-immediately-scale-up" oscillation that kills performance during variable traffic. Scaling up fast is good. Scaling down slowly is wisdom.
Layer 2: Node Scaling — The Capacity Provider
When HPA creates new pods but there's no node capacity to schedule them, you need automatic node provisioning. Two options dominate: Cluster Autoscaler (the established choice) and Karpenter (the newer, more efficient approach).
Cluster Autoscaler works by monitoring for unschedulable pods and scaling node groups up or down. It's reliable and well-understood, but it's coarse-grained — it scales entire node groups, which means you often over-provision. Scale-up takes 2–5 minutes including cloud provider API calls and node bootstrapping.
Karpenter takes a fundamentally different approach: it provisions right-sized nodes per pending pod, choosing the optimal instance type based on the workload's actual requirements. This reduces bin-packing waste and speeds up scale-up to 30–90 seconds. The trade-off is that it's still primarily AWS-centric (EKS) and requires more careful configuration to avoid cost surprises.
Layer 3: Event-Driven Scaling (KEDA) — The Specialist
For workloads driven by message queues, cron schedules, or external event sources, neither HPA nor node autoscaling reacts correctly. KEDA bridges this gap by scaling pods based on external metrics — Kafka topic lag, RabbitMQ queue depth, or database row counts. At 20K users, you'll have background processing workloads that need this kind of precision.
| Autoscaler | Best For | Reaction Time | Key Trade-Off |
|---|---|---|---|
| HPA | Stateless web services, APIs | 15–30 seconds | Needs solid metric baselines |
| VPA | Batch jobs, ML inference | Requires pod restart | Conflicts with HPA on same metrics |
| KEDA | Event-driven (queues, cron) | 15–60 seconds | Additional CRDs and operator overhead |
| Cluster Autoscaler | Standard node pools | 2–5 minutes | Coarse-grained, slow at burst scale |
| Karpenter | Dynamic, right-sized nodes | 30–90 seconds | AWS-centric, still maturing |
5. Observability at Scale
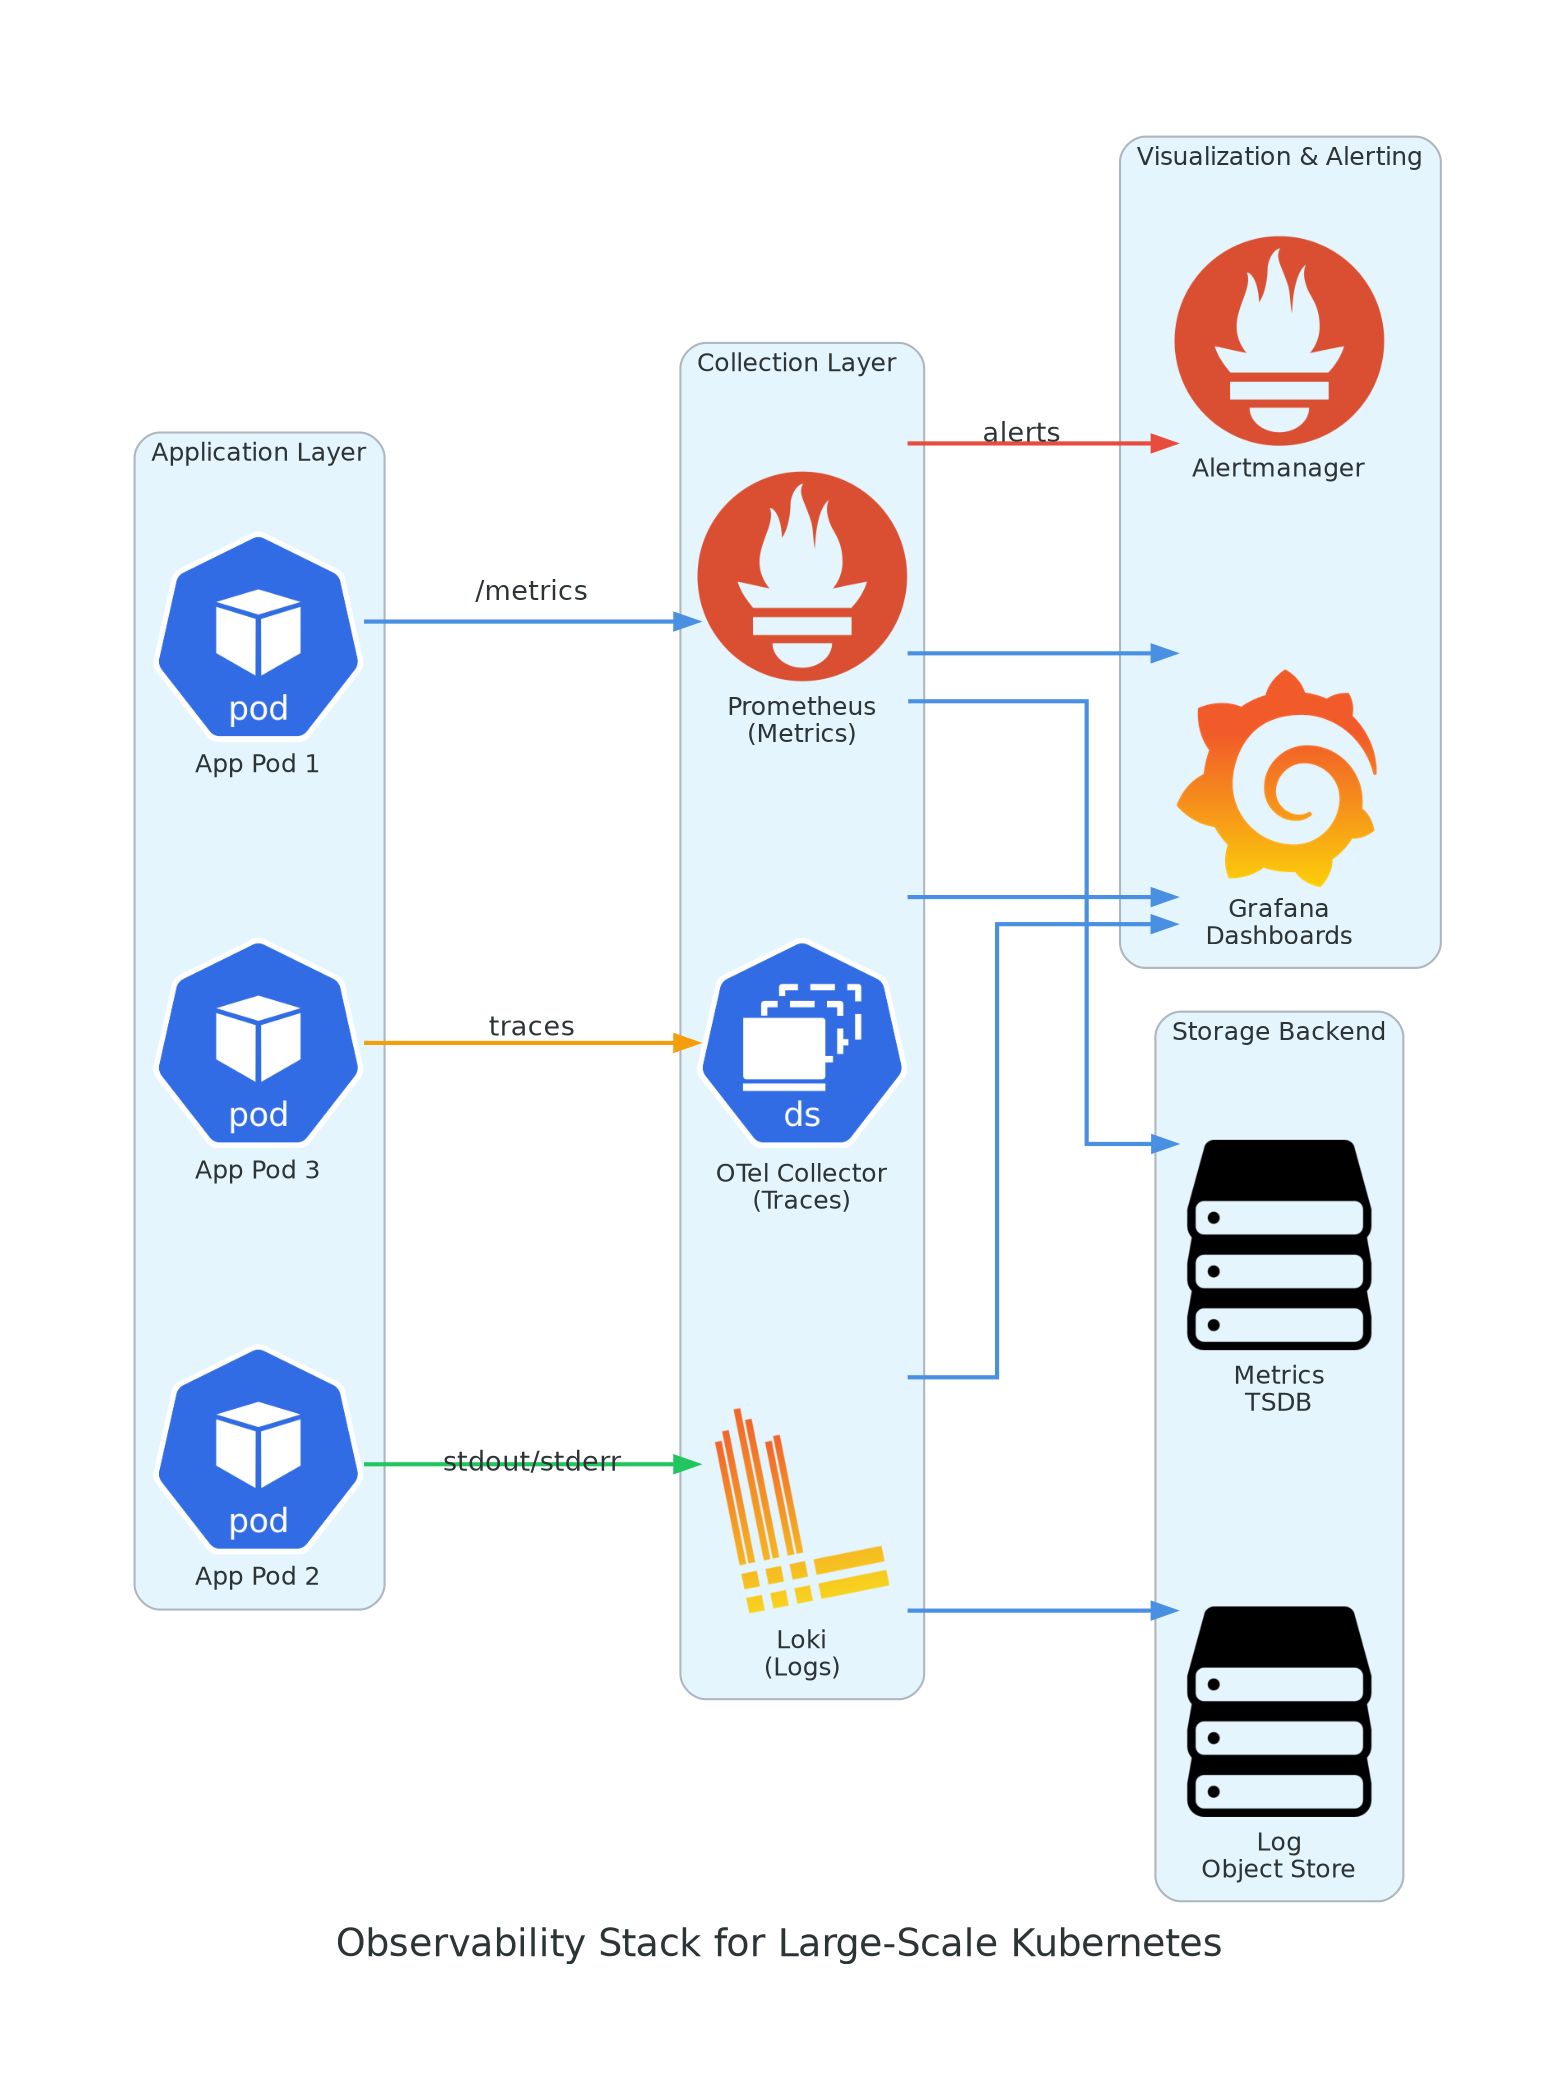
At 20K users generating millions of metrics per minute, tens of gigabytes of logs per hour, and thousands of distributed traces, your observability stack becomes a scaling challenge in its own right. The monitoring system must be as resilient as the applications it monitors — and that's where most teams underinvest.
Prometheus at Scale — When a Single Instance Isn't Enough
A single Prometheus server tops out at roughly 5–10 million active time series. At 20K users with hundreds of pods, dozens of namespaces, and multiple exporters per service, you'll blow past this limit within weeks. Two strategies work at this scale:
Prometheus Federation deploys one Prometheus instance per team or namespace, with a global Prometheus that scrapes aggregated metrics from each. This provides natural isolation — one team's metric explosion doesn't affect another team's monitoring. The downside is operational complexity: you're managing N+1 Prometheus instances.
Remote Write to a long-term store (Thanos, Mimir, or Cortex) is the approach I recommend for most platforms. Your Prometheus instances keep short local retention (6–12 hours) and stream everything to a centralized, horizontally-scalable backend. This gives you unified querying across all namespaces, long-term retention, and deduplication across HA pairs.
The critical detail most teams miss: metric filtering at the remote-write layer. Without relabeling rules that drop noisy, low-value metrics (Go runtime metrics, process-level stats, unused histogram buckets), you'll ship 40–60% more data than necessary to your long-term store — burning storage and query performance for metrics nobody looks at.
The Golden Signals — What Actually Matters at 20K
Non-Negotiable Metrics for Large Platforms
apiserver_request_duration_seconds— API server latency. If p99 exceeds 1 second, your control plane is struggling.etcd_disk_wal_fsync_duration_seconds— etcd disk health. p99 above 10ms means your storage is the bottleneck.scheduler_pending_pods— Scheduling backlog. This should be near zero — any sustained value means capacity or affinity issues.kubelet_running_pods— Per-node pod count. Approaching the node limit silently blocks new scheduling.container_cpu_cfs_throttled_seconds_total— CPU throttling per namespace. High throttling with low utilization means limits are set wrong.kube_resourcequota— Quota utilization per tenant. Teams approaching their quota need proactive planning, not reactive firefighting.node_memory_MemAvailable_bytes— Node memory pressure. When this drops below 10%, the kubelet starts evicting pods.
The Observability Tax
At 20K scale, expect your observability stack to consume 10–15% of total cluster resources. This isn't waste — it's the cost of knowing what's happening. Teams that under-provision monitoring to save costs end up spending 10x more on incident response when things break and they're flying blind.
6. GitOps Deployment Pipeline
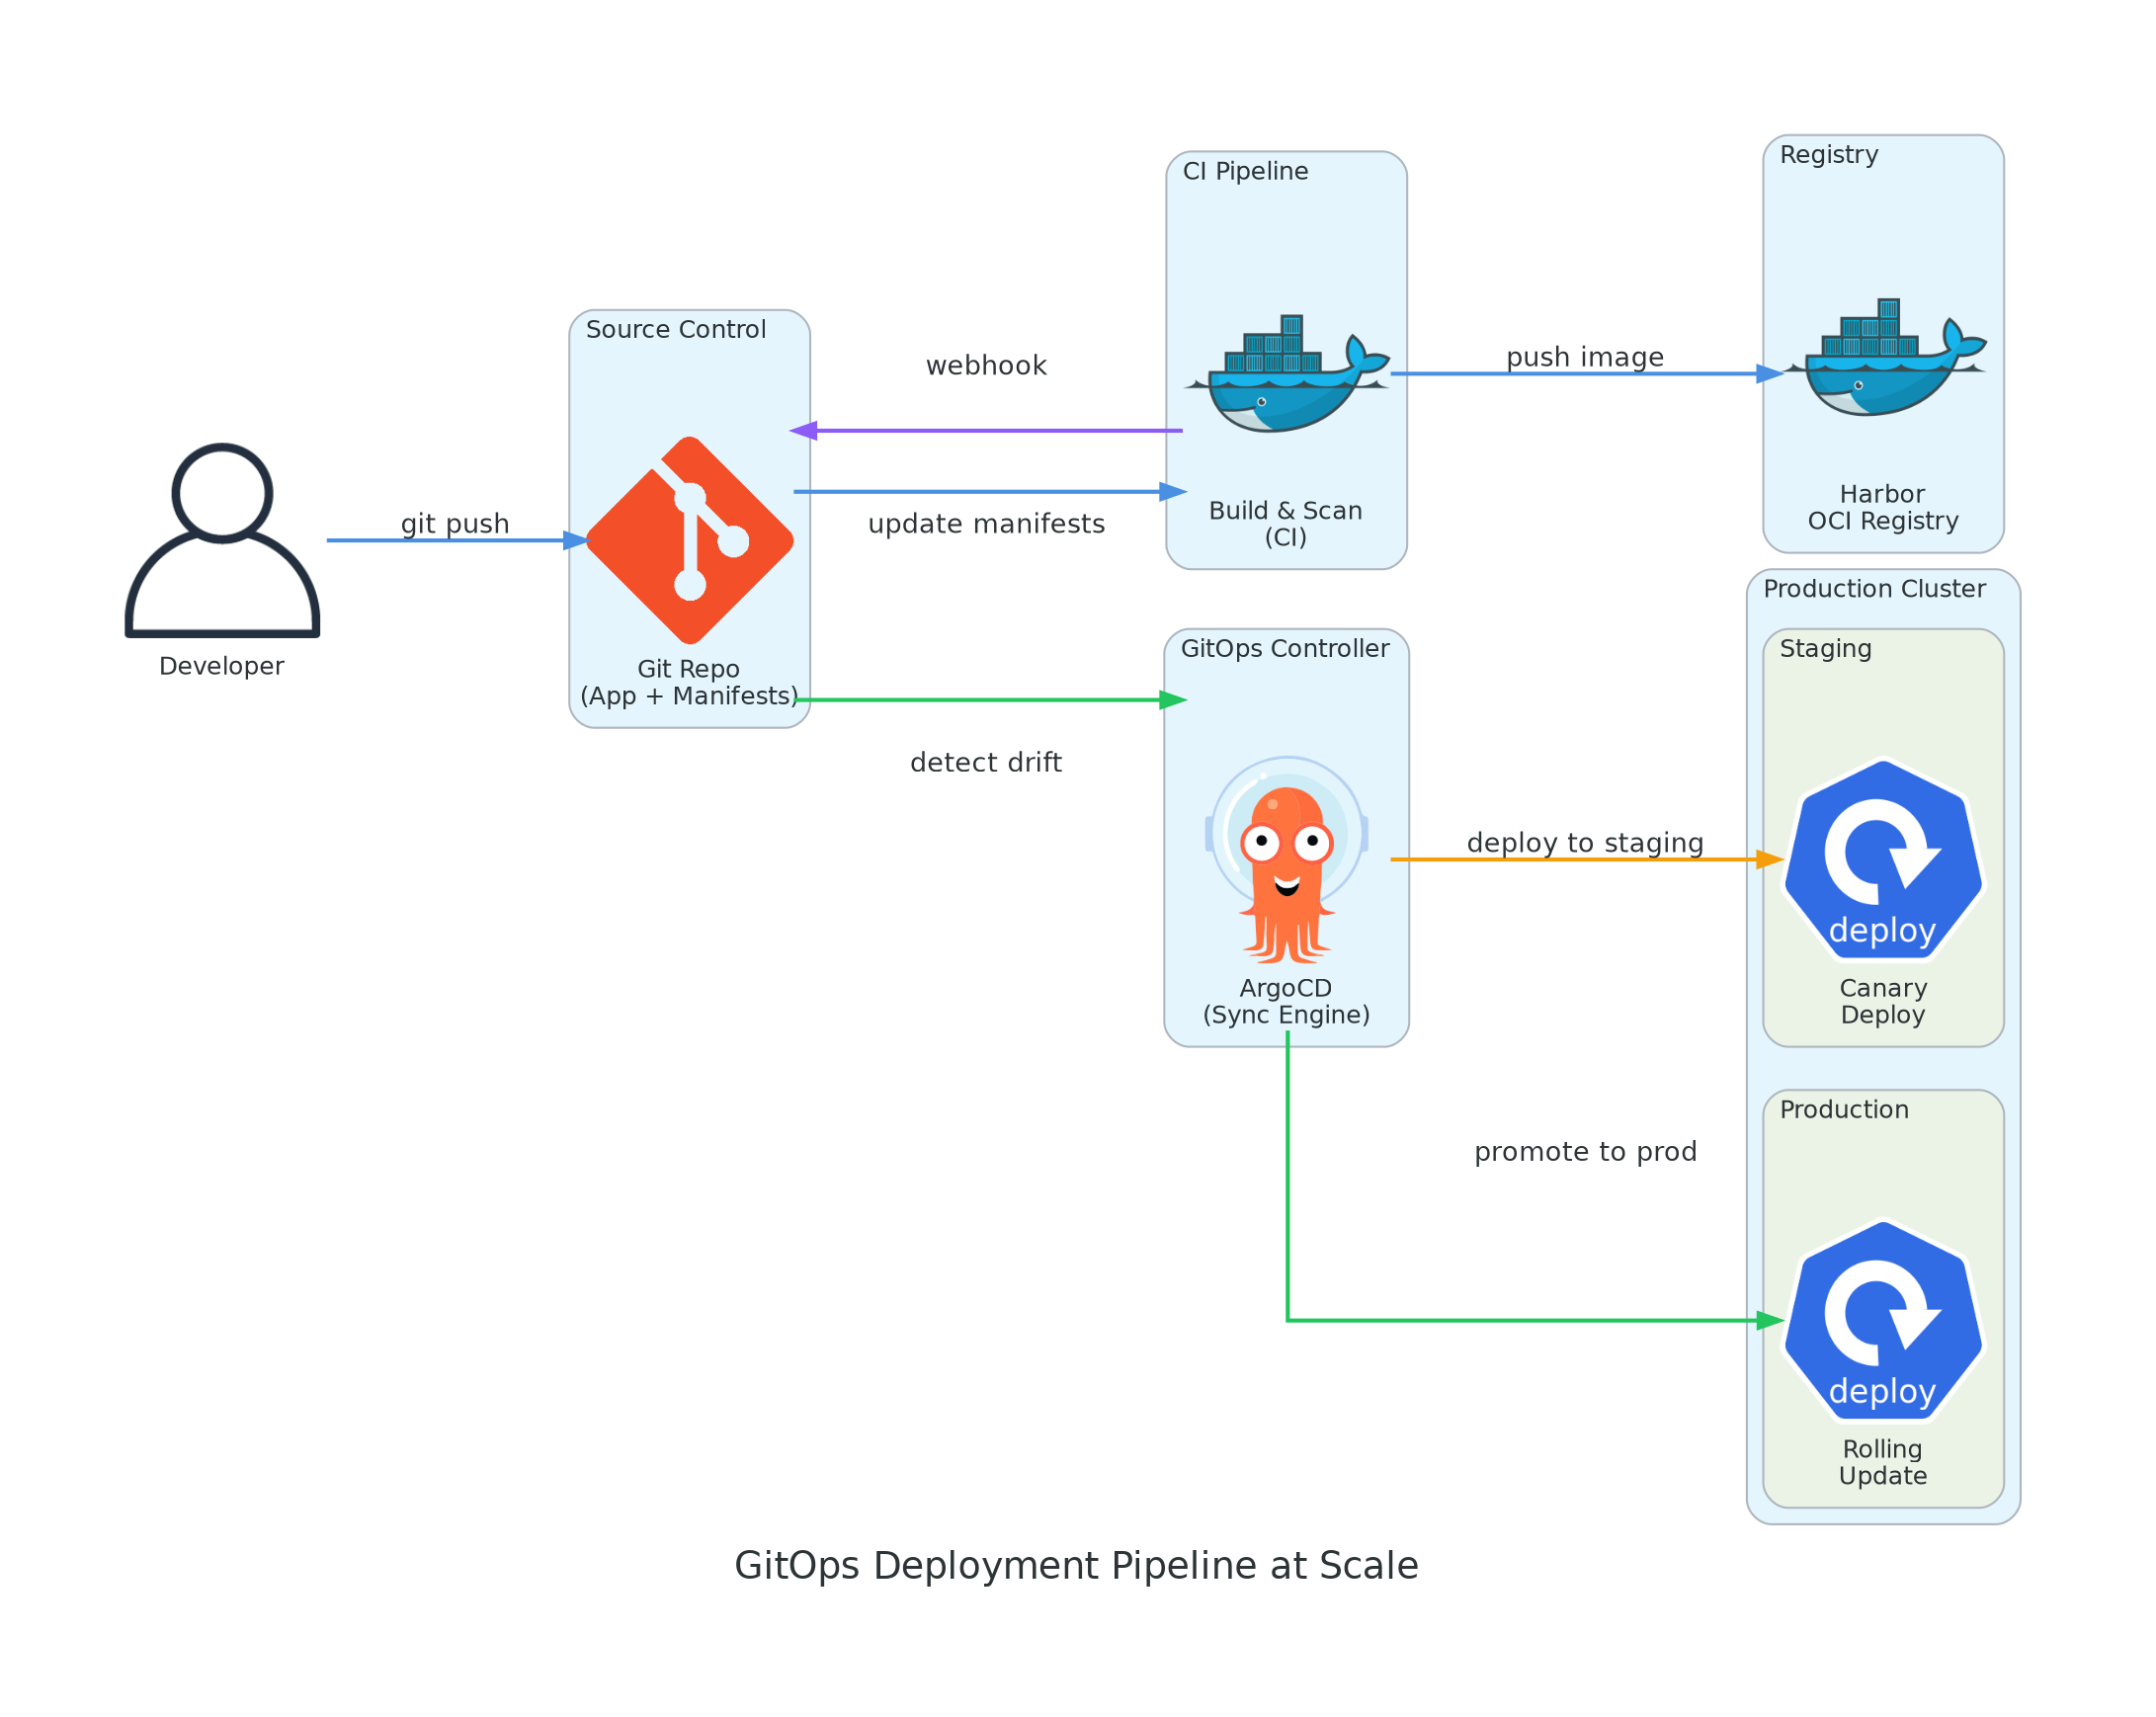
At 20,000+ users, you're not deploying one application — you're orchestrating dozens of teams pushing changes
across hundreds of namespaces. Manual kubectl apply doesn't survive the first day at this scale.
You need a deployment model that's declarative, auditable, and automated.
ArgoCD ApplicationSets — One Template, Many Tenants
The most powerful pattern for multi-tenant GitOps is ArgoCD's ApplicationSet controller. Instead of maintaining individual Application resources for each team — which becomes unmanageable past 10 namespaces — you define a single template that dynamically generates Application resources based on your Git repository structure.
Point the generator at a directory like tenants/* in your config repo, and every subdirectory
automatically becomes a managed ArgoCD Application deployed to its corresponding namespace. Onboarding a new
team becomes a single Git commit: add a directory, push, and ArgoCD handles the rest.
Three settings are critical for this to work at scale:
ServerSideApply must be enabled. With 50+ teams deploying simultaneously, client-side apply causes conflict errors and failed syncs. ServerSideApply delegates conflict resolution to the API server, eliminating deployment failures during high-concurrency sync windows and reducing manifest size over the wire.
ApplyOutOfSyncOnly tells ArgoCD to only reconcile resources that have actually drifted from the desired state. Without this, every sync cycle re-applies every resource in every namespace — generating thousands of unnecessary API server requests that compound the control plane load we discussed in section 2.
Automated pruning with selfHeal ensures that manual changes — someone doing
kubectl edit in production — are automatically reverted to match the Git state. At 20K users, you
cannot rely on humans to avoid ad-hoc changes. The system must enforce the desired state continuously.
The Audit Trail Advantage
Every deployment at this scale generates an audit question: who changed what, when, and why? With GitOps, the answer is always in the Git history. Every production change has a commit author, a review trail, and a diff. This isn't just good engineering — it's a compliance requirement for most enterprises operating at this scale.
Scaling Checklist — The Quick Reference
| # | Practice | Priority | Impact |
|---|---|---|---|
| 1 | HA control plane (3+ nodes, dedicated etcd on NVMe) | 🔴 Critical | Prevents total cluster outages |
| 2 | API Priority and Fairness (APF) configured and tuned | 🔴 Critical | Stops noisy tenants from saturating API server |
| 3 | Namespace isolation (Quota + LimitRange + NetworkPolicy + RBAC) | 🔴 Critical | Security and fairness between teams |
| 4 | Three-layer autoscaling (HPA + Karpenter/CA + KEDA) | 🟠 High | Handles traffic spikes without manual intervention |
| 5 | Prometheus remote-write with aggressive metric filtering | 🟠 High | Observability doesn't collapse under cardinality |
| 6 | GitOps with ArgoCD ApplicationSets + ServerSideApply | 🟠 High | Consistent, auditable multi-tenant deployments |
| 7 | Conservative scale-down policies (5+ min stabilization) | 🟡 Medium | Prevents autoscaler oscillation and latency spikes |
| 8 | etcd compaction + snapshot tuning | 🟡 Medium | Prevents etcd database bloat and slow queries |
| 9 | Pod Disruption Budgets on all stateful workloads | 🟡 Medium | Zero-downtime during node scaling and maintenance |
| 10 | Dedicated ingress controller node pool | 🟡 Medium | Ingress traffic doesn't compete with application workloads |
When Does This Architecture Make Sense?
Let's be honest about the trade-offs. This architecture is designed for platforms where 20,000+ users hit the infrastructure concurrently, multiple teams deploy independently to shared clusters, you need namespace-level cost attribution, and compliance requires an audit trail for every production change.
If you're running a single application serving 500 users, this is massive overkill. A single-node control plane, a basic Deployment with HPA, and a standalone Prometheus + Grafana stack will serve you well for years. Scale your architecture when the pain demands it — not before.
The Real Cost Nobody Talks About
A fully realized platform at this scale requires dedicated platform engineering headcount. Expect 2–4 full-time platform engineers to maintain the control plane, tune autoscaling policies, manage tenant onboarding, operate the observability stack, and handle incident response. The infrastructure is not the expensive part — the people are. Budget accordingly.
Wrapping Up
Scaling Kubernetes to 20,000+ users is less about Kubernetes itself and more about the decisions you build around it. A well-tuned control plane with dedicated etcd storage, strong namespace isolation with enforced quotas, multi-layer autoscaling with conservative scale-down policies, and federated observability with metric filtering — these are the patterns that separate a weekend project from a production platform.
Start with the control plane. Get etcd on its own NVMe. Enforce quotas from day one. Layer in autoscaling and observability as traffic grows. And always, always test your scale-down behavior — because that's where platforms fall over.
Next in the series: Kubernetes Security Hardening for Multi-Tenant Platforms — covering Pod Security Standards, OPA/Gatekeeper policies, image signing with Cosign, and runtime security with Falco. Stay tuned.